CPI (Cycles per Instruction)
CPI by very definition is nothing but the average time taken per instruction by the program. So of-course the lesser the CPI for same program means you have spend lesser time doing same/more instruction.
\[ CPI = \frac{Total\_CPU\_Clock\_Cycles} {Total\_Instuctions\_Executed} \]
The CPI Stack is understanding why a CPI is what it is, it is breaking it down/decomposing it into its constituent parts.
Components: The total CPI is conceptually the sum of a base CPI (The theoretical minimum cycle for the instruction) plus the Stall CPI (The misses and the other latency factors added to the instruction during the time of execution). \[ Total\_CPI \approx Base\_CPI + Stall\_CPI \]
Stall Components: The layers (or stack) represent the additional cycles contributed by inefficiencies, which typically include:- cache misses, branch mispredictions, data dependencies/hazard and resource conflicts.
CPI as a overall metric is used to compare software performance and analyze the bottlenecks at the architectural level but the deep underlying cause of the latency and the CPI can only be done using the CPI stack which talks about the underlying stalls and latency.
Constructing the CPI Stack
From the above section we have understood that the average CPI of a computer program executing on a given microprocessor can be divided into a base CPI plus a number of CPI components that reflect ‘lost’ cycle opportunities due to miss events.
So what is a CPI stack again ? it is nothing but the breakdown of CPI into its respective components. It is referred to as a stack because the CPI data is typically displayed as a stacked histogram bars where the base CPI is shown at the bottom and the rest above. the below diagram shows a CPI stack.
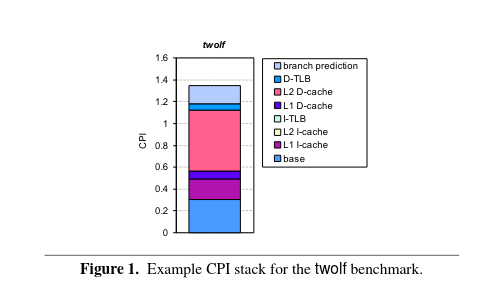
So from a quick first look we see that L2 D-cache miss is the most significant contributing factor and if in some way if L2 D-cache is tuned or if the application’s locality is optimized by the compiler then we can reduce the CPI and boost the performance of the application on the target hardware.